The Projects Dashboard provides an insight into the usage and performance of the projects module in DOQMIND. It does so by visualising curated KPI’s. This dashboard’s intended usage is to assess past performance, rather than manage ongoing projects.
The data is updated in real-time.
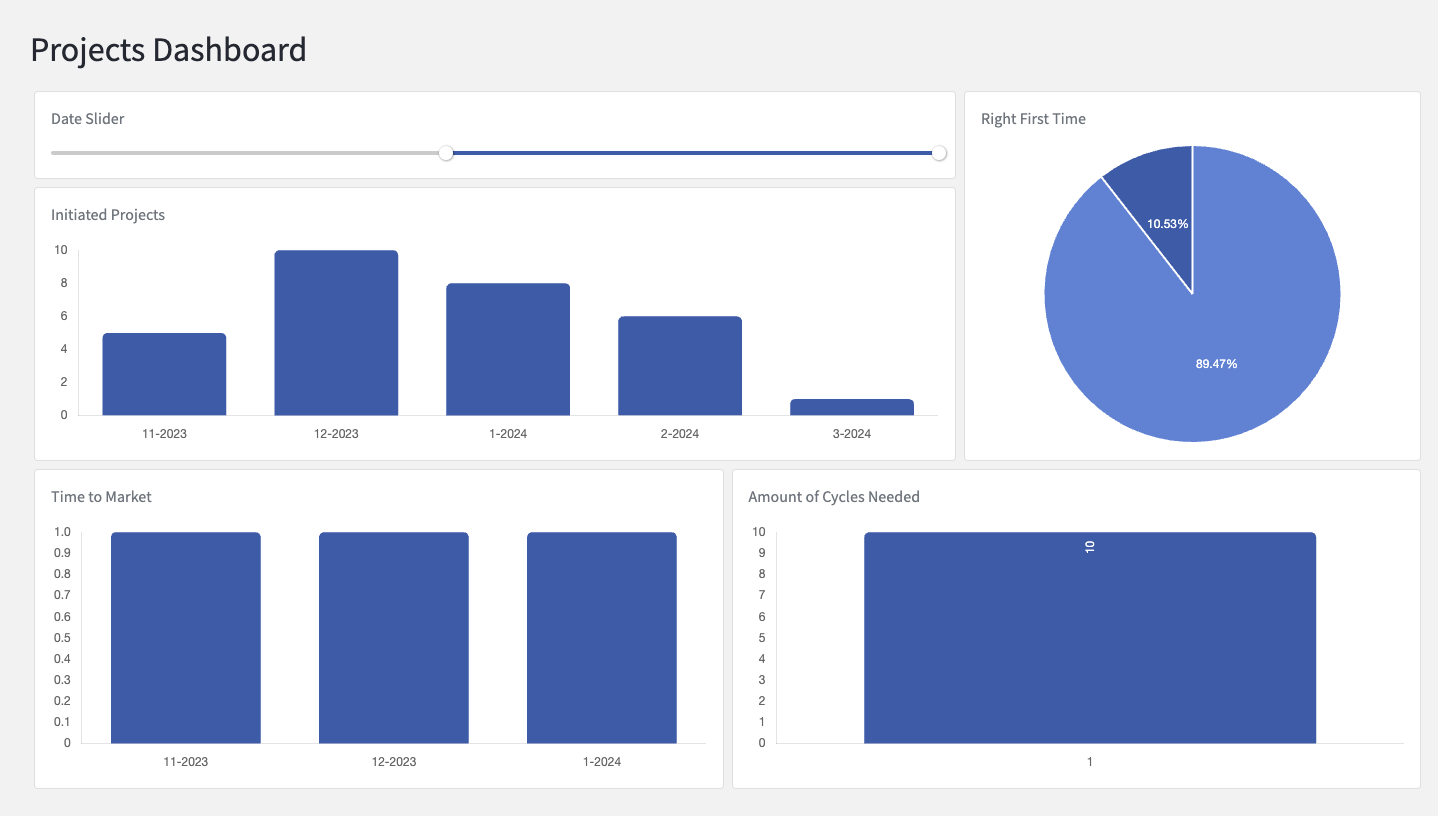
Date Slider
The date slider can be used to limit the timeframe of the data on which the dashboard visuals are built. Simply drag the both dots to set a start and end-date of the desired timeframe. The increment is in months. The range is defined by the earliest and latest start date found in the projects module.
Initiated Projects
Initiated Projects shows the amount of projects started per month. All projects, except the ones with status “Inactive“, are counted.
Time to Market
Time to Market shows average amount of time it took to complete a project. The projects are categorised monthly by start date. All of the projects for this month that have the status “Done” are gathered. For these projects, the average project length is calculated.
Amount of Cycles Needed
The Amount of Cycles Needed shows you the amount of tasks that required a certain amount of cycles. These amounts are categorised horizontally.
Tasks with the following parameters are counted:
-
Are part of a project that has status “Done”
-
Are of the type “Approval”
This list is divided into categories. These categories are determined by “task_iteration”. Only the last iteration of a task is counted. For example: if a task is repeated 2 times, the original execution and the first repetition is not counted, only the second repetition, which is the last iteration in this case, is counted.
Right First Time
Right First Time shows a global number for the given timeframe. This number indicates indicates how often we only need one approval cycle versus how often we do need more than 1 approval cycle.
Light blue shows the percentage of tasks that was correct from the first cycle. These tasks were never repeated.
Dark blue shows the percentage of tasks that were repeated at least once.
The tasks that are counted are the same tasks counted in “Amount of Cycles Needed”: Approval task in done projects.